Echarts算是国内JS图表插件一顶一的优秀了,通过JSON配置项就可以轻松实现丰富多样的图表效果。
为了做一个数据统计图表的需求,翻来覆去尝试,好在最后各种效果基本都实现了。
配置项统一写在一个方法中xaxis_data 是x轴的类目,格式为 [{index: 0, date: 1488962498826}, …]chart_data 是渲染数据,格式为 [1, 0, …]1
2
3
4
5
6
7
8require(['echarts'], function(echarts) {
var echart = echarts.init($('.charts')[0]);
echart.setOption(getEchartsOption.call(echart, echarts, xaxis_data, chart_data));
});
var getEchartsOption = function(echarts, xaxis_data, chart_data) {
var self = this;
return {...};
};
第一版
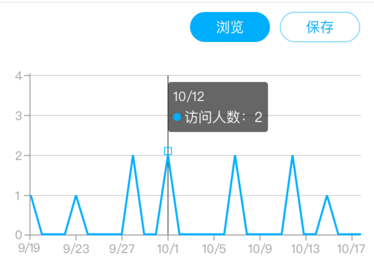
浏览按钮和保存按钮分别对应一张表,点击切换
图表左右上下均有留白:
1
2
3
4
5
6
7
8grid: {
top: 32,
bottom: 23,
right: 10,
// _calcEchartsLeft方法根据chart_data最大值计算出图表y轴到容器左边的距离
// 第一个参数表示一个字符的宽度
left: _calcEchartsLeft(7, chart_data) || 'auto'
},不显示标记点:
1
series[i]-line.showSymbol: false
x轴设置:
1
2
3
4
5
6
7
8
9
10
11
12xAxis: {
data: xaxis_data,
boundaryGap: false, // 留白策略,若为柱状图则按需置为true
axisLine: {
lineStyle: {
color: '#A0A0A0'
}
},
axisLabel: {
interval: 3 // 每隔3个数据显示一个label
}
}y轴lable只显示整数:yAxis
1
2
3
4
5
6
7
8
9axisLabel: {
formatter: function(value, index) {
// 不显示小数刻度
if(parseInt(value) != value) {
return '';
}
return (value);
}
}线的样式:
1
series[i]-line.itemStyle.normal.color: '#00AFFE'
标记点使用空心方形:
1
series[i]-line.symbol: 'emptyrect'
ECharts 提供的标记类型包括
'circle','rect','roundRect','triangle','diamond','pin','arrow'
类型均支持empty前缀。
也可以通过 'image://url' 设置为图片,其中 url 为图片的链接;通过 'path://' 将图标设置为任意的矢量路径。
tooltip内容格式化:
提示框浮层内容可以通过格式器formatter进行模板配置。
折线(区域)图、柱状(条形)图、K线图 :{a}(系列名称),{b}(类目值),{c}(数值), {d}(无)
第一版的提示框样式和模板是默认样式,{b} x轴,月/日;{a} series[i]-line.name;{c} y轴值tooltip显示位置固定y坐标
- tooltip在图表区域内显示:
1
2
3
4
5
6
7
8
9
10
11
12
13
14
15
16
17
18
19tooltip: {
trigger: 'axis',
position: function (point, params, dom) {
// tooltip显示位置固定y坐标:37
// tooltip在图表区域内显示
if (point[0] + 20 + dom.offsetWidth > view.width()) {
return [point[0] + 5 - **dom.offsetWidth, 37];**
}
return [point[0]+5, 37];
},
axisPointer: {
lineStyle: {
color: '#5F5F5F'
}
},
textStyle: {
fontFamily: '"Microsoft YaHei", Arial, sans-serif'
}
}
第二版

图表左右无留白:
1
2
3
4
5
6grid: {
top: 35,
bottom: 30,
right: 0,
left: 0
}图表区域纹理贴图:series[i]-line.areaStyle
1
2
3
4
5
6
7
8
9
10
11var patternImg = new Image();
patternImg.src = STATIC_URL + '/images/line_x1.png';
// ...中间代码省略
areaStyle: {
normal : {
color: {
image: patternImg,
repeat: 'repeat-x'
}
}
}不显示标记点
点击时显示蓝色实心点:series[i]
1
2
3
4
5
6
7
8
9
10
11
12
13
14
15
16
17
18
19
20// 方式一:
itemStyle: {
normal: {
opacity: 0
},
emphasis: {
opacity: 1,
color: '#008BFD',
borderWidth: 0
}
}
// 方式二:
showSymbol: false,
itemStyle: {
emphasis: {
opacity: 1,
color: '#008BFD',
borderWidth: 0
}
}首尾平滑绘制:
数据处理时在xaxis_data、chart_data的首尾分别添加3个值相同的数据,置index为-1。x轴label格式化
- 长短两种不同刻度:两个xAxis叠加
xAxis[0]为短刻度:1
2
3
4
5
6
7
8
9
10
11axisLabel: {
show: false // 不显示label
},
axisTick: {
inside: true, // 坐标轴刻度朝内
length: 3, // 刻度长度
interval: 0,
lineStyle: {
color: '#87CBFF'
}
}
xAxis[1]为长刻度:1
2
3
4
5
6
7
8
9
10
11
12
13
14
15
16
17
18
19
20position: 'bottom',
axisLabel: {
interval: 2,
margin: 4, // label距离轴的距离
formatter: function(value, index) {
if(value.index < 0) { // 不显示index为-1的数据label
return '';
}
// label格式化
return (new Date(value.date * 1000)).Format("d");
}
},
axisTick: {
inside: true, // 坐标轴刻度朝内
length: 6, // 刻度长度
interval: 2,
lineStyle: {
color: '#29A2FF'
}
}
- 线的渐变色
尾部线无颜色:
1
2
3
4series[i]-line.itemStyle.normal.color: new echarts.graphic.LinearGradient(0, 0, 1, 0,
[{offset: 0, color: '#40DBFF'},
{offset: 0.97, color: '#008BFD'},
{offset: 0.97, color: 'transparent'}], false)计数第一天使用空心圆标记:
1
2
3
4
5
6
7
8
9
10
11
12
13
14
15
16
17
18
19
20
21
22
23markPoint: {
// 此处用svg代替'emptyCircle',是因为在某些手机上emptyCircle有bug
symbol: 'path://M7,3.5 C7,1.56700338 5.43299662,0 3.5,0 C1.56700338,0 0,1.56700338 0,3.5 C0,5.43299662 1.56700338,7 3.5,7 C5.43299662,7 7,5.43299662 7,3.5 Z',
symbolSize: 6,
itemStyle: {
normal: {
color: '#FFFFFF', // 中心圆圈颜色
borderColor: '#32A3FC', // 蓝色描边
borderWidth: 1
}
},
label:{
normal: {
textStyle: {
color: 'transparent' // 隐藏markPoint文字
}
}
},
data: [{
name: xaxis_data[3],
coord: [3, chart_data[3]] // 标记点坐标
}]
}标记线不超出数据线:
没有实现。tooltip显示位置固定x坐标、y坐标
- tooltip内容格式化、自定义样式
- 首尾部分的点,点击不显示tooltip:
1
2
3
4
5
6
7
8
9
10
11
12
13
14
15
16
17
18
19
20
21
22
23
24
25
26
27tooltip: {
show: true,
trigger: 'axis',
backgroundColor: 'transparent',
extraCssText: 'box-sizing: border-box;width: 100%;text-align:center;color: #008BFD',
position: ['0', '109px'], // 固定x坐标、y坐标
transitionDuration: 0, // 设置为 0 的时候会紧跟着鼠标移动
axisPointer: {
type: 'line',
lineStyle: {
color: '#008BFD'
}
},
formatter: function (params) {
// 首尾部分的点,点击不显示tooltip
if(params[0] && params[0].name.index < 0) {
self.dispatchAction({
type: 'hideTip'
});
return '';
}
// 内容格式化、自定义样式
var time = (new Date(params[0].name.date * 1000)).Format("M月d日访客");
return "<div style='font-size: 44px;line-height: 44px;font-weight: bold;text-shadow: 3px 3px 0 #fff'>"+ params[0].data +"</div>" +
"<div style='font-size: 14px;line-height: 20px;text-shadow: 3px 3px 0 #fff'>"+ time +"</div>";
}
}
第三版

x轴首尾不显示刻度:
1
2
3
4
5
6
7
8
9
10
11
12
13xAxis[0].axisTick.interval: function(index, name) {
if(name.index < 0) {
return false;
}
return true;
}
xAxis[1].axisTick.interval: function(index) {
if(index > 0 && index < 33 && index%3 === 0) {
return true;
}
return false;
}首尾部分数据不进行绘制:
当chart_data的值为‘-’时,则不会绘制图形。
所以首尾分别插入3个‘-’即可。第一个数据和最后一个数据使用实心圆标记:
1
2
3
4
5
6
7series[i]-line.markPoint.data: [{
name: xaxis_data[3],
coord: [3, chart_data[3]]
}, {
name: xaxis_data[xaxis_data.length-1],
coord: [32, chart_data[32]]
}]